Artlo in Altair
Altair is the python interface to the declarative Vega visualization library.
There are many differences between altair and matplotlib, but one important difference is Encoding Data Types. For altair, it is important to know the difference between these types and when to use them as they effect the color and representation of your data.
To enable a salo style:
import altair as alt
import artlo

artlo.plot.set_alt_style('salo-dark')
Create some testing data:
path = gpd.datasets.get_path('naturalearth_lowres')
df = gpd.read_file(path)
df['c_var'] = np.random.random(df.shape[0])
df['d_var'] = np.random.choice(['a', 'b', 'c', 'd'], size=df.shape[0])
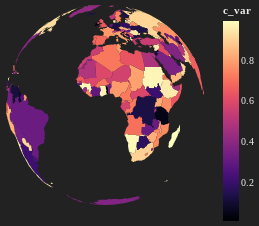
Without providing any styling options to a plot you will get the style's defaults:
alt.Chart(df).mark_geoshape().encode(
    'c_var:Q',
).project(
    'orthographic'
)
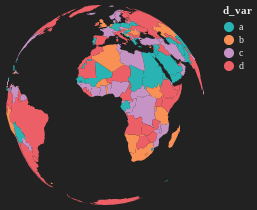
Here is the same default, but using the nominal encoding on a discrete variable:
alt.Chart(df).mark_geoshape().encode(
    'd_var:N',
).project(
    'orthographic'
)
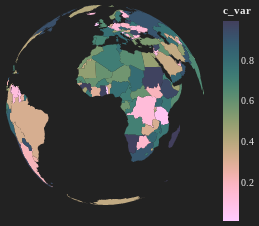
You can also use a salo custom color palette:
alt.Chart(df).mark_geoshape().encode(
    color=alt.Color(
        'c_var:Q',
        scale=alt.Scale(range=artlo.color.palettes['titan'])
    )
).project(
    'orthographic'
)
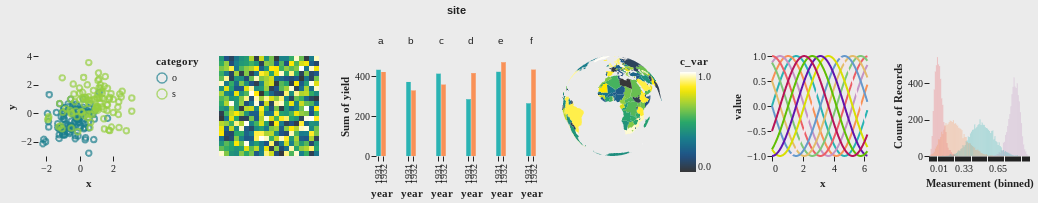
salo-dark
artlo.plot.set_alt_style('salo-dark')
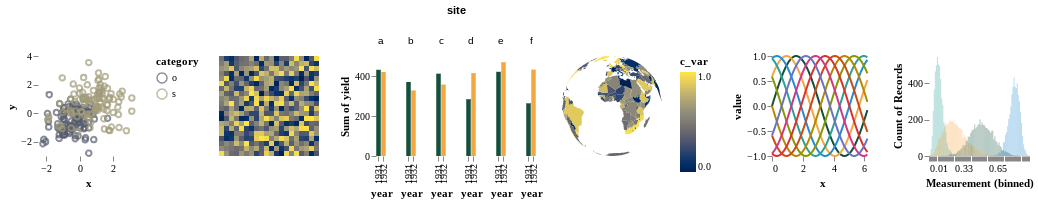
salo-light
artlo.plot.set_alt_style('salo-light')
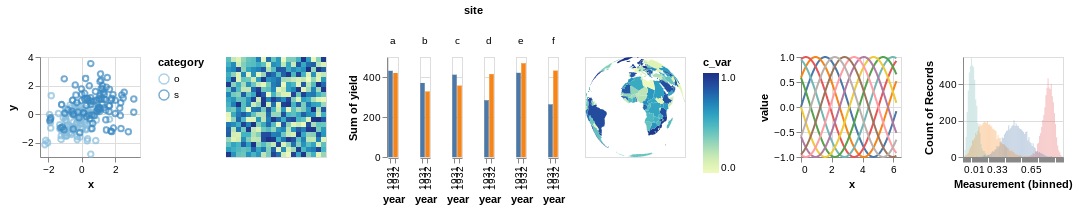
cfo-light
artlo.plot.set_alt_style('cfo-light')
For reference, here is the default altair plotting style:
Code documentation
Lists the available altair plotting styles.
Returns:
| Name | Type | Description |
|---|---|---|
styles | list of style names to pass to |
Source code in artlo/plot.py
64 65 66 67 68 69 70 71 72 73 74 75 76 77 78 | |
Sets a series of altair plot style parameters.
Parameters:
| Name | Type | Description | Default |
|---|---|---|---|
style |
str of the style name to use. from |
required |
Returns:
| Type | Description |
|---|---|
None. Updates altair.themes |
Source code in artlo/plot.py
50 51 52 53 54 55 56 57 58 59 60 61 | |